
Now that the sampling, lab work and project writeup is all finished, I have detailed below some of my key findings and interpretations of the data. As has been mentioned in previous blog pieces, the biggest single finding from my research has been the paucity of data relating to the processes at play within the Adur Estuary, and how much more research is needed.
So what did I find?
Suspended sediment concentrations (SSC) within the samples were quite consistent across all samples collected. In the end, I collected ten full sets of samples across the three transects, five during Spring tides, and five during neap tides.
I also collected two sets of samples from a single location across an entire tidal cycle. Whilst sitting in the middle of the estuary for 13 hours may not be everyone’s idea of fun, the results I gained from these two data sets (again from both Spring and Neap tides) was really interesting.
The first thing to say about SSC from all twelve data sets is that they are incredibly low. Research conducted in macro tidal estuaries suggested SSC levels should have been in the range of 1000 to 10,000 ppm. The difference in tide heights between high and low water (tidal range) means that there is lots of energy in the water as it flows into and out of the estuary, thus enabling larger quantities of SSC to be present.
My findings for the Adur estuary showed typical results of around 30ppm, an incredibly low figure for a macro tidal estuary.
I would imagine that initial reactions to this will be surprise and relief, after all less SSC means less dredging and restriction to shipping channels. However, it would also mean less sediment available to the salt marshes and mud banks within the estuary to maintain their heights in a world of rising sea levels though.
The type of sediment carried within the water column is very interesting too. Analysis of the sediment contained within the samples, by passing it through a Laser Particle Size Analyser (LPSA) shows that the majority of SSC are silts and clays, with a surprisingly small amount of sand size particles contained within the water column.

The further right on the table the larger the grain size of the SSC gets. The red line demonstrates SSC at the mouth of the river, showing a small increase in sand sized grains.
The closer to open water samples were collected, so the concentration of sand size particles increased, but even as far downstream as the RNLI slipway, concentrations of sand particles were very low (<30% by volume).
This lack of sand size particles would perhaps suggest minimal marine sediment intrusion, or a much lower than expected energy regime within the estuary meaning the larger sand particles just cannot be picked up and carried by the water flow.
Data sets produced from a complete tidal cycle show a clearly defined and significant increase in SSC during the middle to later sections of the ebb tide. These spikes in SSC were almost identical during both Spring and Neap tides, also, high water slack tide and the flood tide both showed very reduced SSC levels.
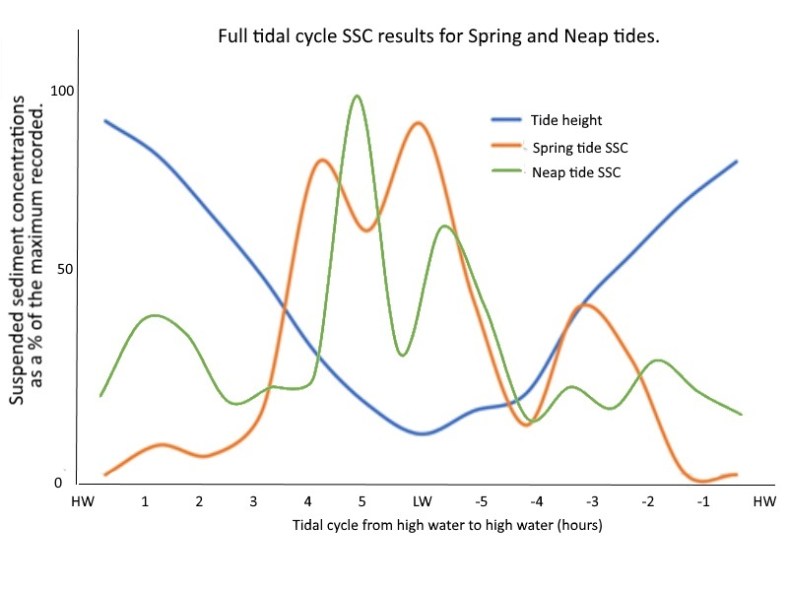
SSC concentrations over an entire tidal cycle, with peak SSC values during the later stages of the ebb tide.
These results show that the estuary is an ebb tide dominated regime, with the falling tide being the period during which entrainment of sediment and its transportation within the estuary is at its greatest. These results imply that the Adur estuary is an asymmetrical tidal regime, with the flood tide occurring quickly, followed by a much more extended ebb tide due to the constricted shape of the estuary which extends ~8km inland. This long thin shape of the estuary (exacerbated by modern seawalls and flood defences) means that the retreating tide produces a ‘log jam’ effect upstream and causes the strength and period of the ebb tide to become extended.
These findings need much more empirical research to confirm, but personal anecdotal evidence of the delay between high tide at the estuary mouth and the beginning of the ebb tide upstream from Bramber supports the asymmetrical hypothesis. I found a delay of ~2 hours before the tidal flood waters started to recede after the tide table declaration of when it should have begun.

A Map showing the survey location and the confined but extended length of the river influenced by the tides.
